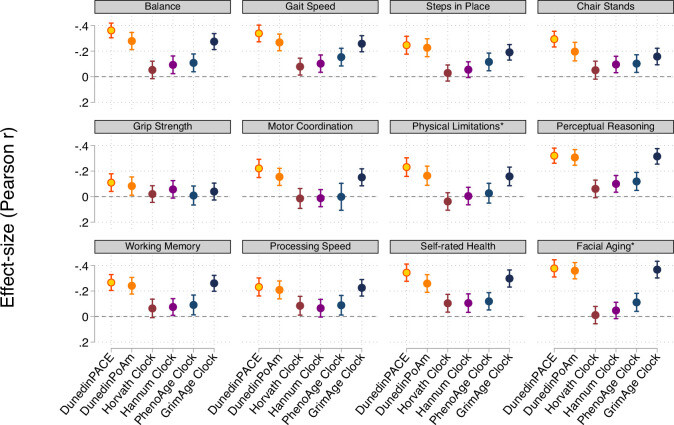
DunedinPACE tracks changes in 19 biomarkers of organ-system integrity in the 1000-member Dunedin Study birth cohort, who were first enrolled in the study at birth in 1972-1973 and have been followed up ever since, most recently at the time of their 45th birthday. This study used data collected from the participants when they were all aged 26, 32, 38, and 45 years.

I mean, they did a longitudinal study, and that longitudinal study mostly looked at markers of strength or capacity rather than markers of damage.

And if it’s strength/capacity changes with age, then [a] calorie restriction may prevent an increase, [b] they can be easily corrected with follistatin or GDF15 or whatever.

So DunedinPACE was taken out of this study

https://www.pnas.org/doi/10.1073/pnas.1506264112

Ok, so you have to differentiate between the biomarkers that don’t change with age in super-healthy people (eg Mike Lustgarten or CRONites) [and the blood tests/blood pressure/waist to hip ratio of CRONites pretty much does not change for that entire range] from those that do change with age (which is, like, uh, just FEV1/FVC, leukocyte telomere length, and… uhh… that’s it?) [I don’t know if they used these markers to detect pace of aging change because, like, the vast majority don’t change in super-healthy people]… There are way better ones

We used data from the Dunedin Study 1972-1973 birth cohort tracking within-individual decline in 19 indicators of organ-system integrity across four time points spanning two decades to model Pace of Aging

(well, if you look at the above traits HERE, then yes, most of these DO change with age over that timecourse, even in ultra-healthy people [eg even with the best possible diet, a 35 year old is unlikely to be a grandmaster starcraft player or youthful olympic athlete]). These things are harder for someone to measure longitudinally from afar except in the context of a clinic, however. Even routine doctor visits fail to measure these…
image

====

Random notes on fraility and GDF15 below::

=====

  • coders of longevity variants have lower GDF15 ()on effect of longevity variants on molecular aging rate)
  • Several proteomic studies using the SOMAscan platform have
    investigated the proteomic profiles of aging-related outcomes and
    reported associated observation of GDF-15, PTN, spondin-1, URB, FSTL3,
    and SMOC1 with frailty and mobility disability, and mortality, in older
    people (Osawa et al., 2020; Sathyan, Ayers, Gao, Milman, et al., 2020; Sathyan, Ayers, Gao, Weiss, et al., 2020).
    Of these, GDF-15, a stress-induced cytokine and a divergent member of
    the transforming growth factor (TGF)-β superfamily, was the protein most
    strongly associated with physical function decline in our study. Recent
    studies have consistently demonstrated the upregulation of GDF-15 in
    aging (Tanaka et al., 2018)
    and showed that higher GDF-15 relates to higher risk of diabetes,
    cancer, cognitive impairment, cardiovascular diseases, and mortality
    (Justice et al., 2018).
    It has been proposed that GDF-15 is a stress-induced cytokine in
    response to tissue injury and can be utilized as a biomarker for various
    diseases (Emmerson et al., 2018).
    An Italian cohort study showed that GDF-15 is associated with the
    development of mobility disability in community-dwelling older adults
    (Osawa et al., 2020).
    Furthermore, investigators from the Baltimore Longitudinal Study of
    Aging (BLSA) found that elevated plasma GDF-15 was associated with
    slower gait speed and low physical performance but not with muscle
    strength in community-dwelling adults (Semba et al., 2020).
    However, this study included very healthy adults and adopted a
    cross-sectional design and therefore is limited in revealing biomarkers
    for longitudinal changes in physical function. More work is needed to
    further elucidate the underlying molecular mechanisms of GDF-15 in
    functional decline.

4 Likes

https://www.nature.com/articles/s41591-023-02296-6.epdf?sharing_token=cxmOtB1Iw_MbDd2U0lSEgNRgN0jAjWel9jnR3ZoTv0OWodFeghpV2Eg7h1VHME-JZpRoMXLtUkOa8OhkD13Q0SO8-S7SkW1ddRzEn1NQfSQjJ2aBqF0AEuA4NdWU5Qr_sqqOrk0E-Q96-y8cyUDsvaayrR0tRrOmDMKlhvwE7Wo%3D

Additionally, a whole-body predictive model was estab-lished using all body phenotypes, irrespective of organ grouping. Keymeasures used to assess individual organ function are as follows (alsosee Fig. 1a):• Cardiovascular system: pulse rate, systolic blood pressure anddiastolic blood pressure.• Pulmonary system: FVC, FEV1, PEF and FEV1 :FVC ratio.• Musculoskeletal system: handgrip strength, standing height,weight, BMI, waist and hip circumference, waist:hip circumfer-ence ratio, heal bone mineral density, ankle spacing width,blood biochemical markers such as phosphatase, calcium,phosphate and vitamin D.• Immune system: C-reactive protein and blood hematology testsof leukocytes, erythrocytes, thrombocytes and hemoglobin.• Renal system: biomarkers associated with glomerular filtrationand electrolyte regulation, including creatinine (enzymatic),potassium and sodium in urine, albumin, urea, urate, creatinine,cystatin C, phosphate and total protein in blood.• Hepatic system: alanine aminotransferase, aspartate ami-notransferase, γ-glutamyl transferase, direct and total bilirubin,albumin, alkaline phosphatase and total protein in blood.• Metabolic system: blood biomarkers associated with lipids andglucose metabolism, including apolipoprotein A, apolipopro-tein B, cholesterol, glucose, glycated hemoglobin, high-densitylipoprotein cholesterol, direct low-density lipoprotein choles-terol, lipoprotein A and triglyceride

[I don’t think these are the best panels, they’re very low resolution and unlikely to find aging in calorie-restricted individuals)

2 Likes

Well mine is 0.59… Supposedly it goes up with age…

Among people who have the “slow ager” phenotype, I do wonder if some parts of their system do still age and that (while they don’t affect much when people are young) at the end these parts of the system slowly catch up with them and destroy them, even if they’re otherwise super-fit at 100 [amyloidosis, or maybe DNA damage, or maybe some parts of aging, like aspartic acid racemization, that are less “modified” by changes like dietary restriction].

1 Like

HannumAge is MORE associated with adapt-age than damage-age, as is HorvathAge. DNAm that contribute to HorvathAge/HannumAge have little functional significance

GrimAge outperforms phenoage… (there is also a phenoage2 that is just trained on more data than phenoage)

Then there’s GrimAge2, which supposedly outperforms GrimAge (trained on more data). A source says that GrimAge outperforms PhenoAge (p-value is several OOM different) and all other clocks.

3 Likes

How do you actually get tested on GrimAge? Is there a website to get the test?

You get the raw methylation values from the idat file (you can request from TruDiagnostic) then run the age calculators through one of many code repositories (or get someone to run the code for you). GrimAge is not open-source but some variations of it are

3 Likes

4 Likes

I am assuming they meant ‘reliable clocks’ in line 2.

Or they really like roosters.

Or maybe the BBC.

What a typo! :open_mouth:

1 Like

Linking biological age and brain health: a new study co-authored by Contributor and Symposium speaker explores DunedinPACE, an epigenetic measure of aging, and its connection to brain structure.

https://twitter.com/agingbiomarkers/status/1724093770252095556

1 Like

A recent, and good intro, writeup by the NIH on aging clocks:

Before you can tell if a treatment could slow or even reverse aging, you need to know how fast someone is aging in the first place. It’s no secret that people age at different rates. Some people remain healthy and disease-free well into their ninth or even 10th decade of life. Others develop age-related diseases, such as cancer, heart disease, and dementia, much earlier. The concept of “biological age” is often used to describe these differences. Biological age reflects the molecular damage that accumulates over the years and eventually leads to disease and disability.

Differences in biological age can develop years before age-related diseases appear. So, a treatment to slow aging would also need to start well before such diseases appear. Then, to find out if a treatment worked or not, you’d have to track people for the rest of their lives. That’s why researchers have been working to develop “aging clocks” to measure a person’s biological age.

One approach is to measure various biomarkers and compare them to what’s typical for a given chronological age. Dr. Daniel Belsky, who studies aging at the Columbia University Mailman School of Public Health, explains, “We use the general population as a reference, and we say, ‘The average 50-year-old looks like this, the average 60-year-old looks like this, the average 70-year-old looks like this.’ We take your biomarker levels and line them up against that population average, and we say, ‘Aha, you look about like a 55-year-old, so we’re going to call you biologically 55.’ If you happen to be 65 years old, that’s great news. If you happen to be 45, it’s not great news.”

Belsky has taken this a step further. Instead of just an aging clock, which shows how much someone has aged, Belsky’s team, in collaboration with Dr. Terrie Moffitt’s team at Duke University and the Dunedin Longitudinal Study, developed an aging “speedometer.” It shows how fast or slow someone is aging.

The researchers focused on chemical modifications to DNA, called DNA methylation, that change with age. To develop the measure, they used data from the Dunedin Study, a long-term health study of more than 1,000 people born in New Zealand in 1972-73. As part of the study, participants received comprehensive health evaluations at four time points from ages 26 to 45. These gathered DNA methylation data from blood samples and 19 biomarkers that track the function of various organ systems. Using machine-learning tools, the team developed an algorithm to identify DNA methylation patterns at age 45 that correlate with changes in the 19 biomarkers over a 20-year period. They named this algorithm DunedinPACE (Dunedin Pace of Aging Calculated from the Epigenome).

https://www.nia.nih.gov/news/research-context-can-we-slow-aging

and for those curious… when I first heard of the DunedinPACE clock I though “what’s a Dunedin”… its a place in New Zealand where the study took place:

3 Likes

Great article! I wish Tony Wyss-Coray would stop doing these damn interviews and give us the Teal Omics proteomics clock. :wink:

Here’s another great article on BioAge testing.

https://factor.niehs.nih.gov/2024/10/feature/4-feature-the-exposome-and-individualized-medicine

In my view, those other omics — proteomics, transcriptomics, methylomics, microbiomics, and so forth — reflect the broader impact of exposures on our biology, to say nothing of exposomics itself. The ones I mentioned provide critical knowledge about proteins we produce, gene expression patterns, chemical modifications regulating genes, and the role of microorganisms in our health.

At Mayo Clinic, we’ve spent the last five years sequencing the exomes of about 100,000 individuals seen in our practices. The exome refers to all — about 20,000 — genes in the genome that produce proteins. We now have available those individuals’ exome sequences and are providing access of these data to more than 120 scientific groups conducting research in more than fifty diseases. As we move forward, we’re creating a smaller cohort of about 50,000 patients to start doing methylomics, transcriptomics, proteomics, and microbiomics testing using blood, urine, stool, and saliva samples. The goal is not only to analyze each kind of omics data separately but also to integrate several omics together in a way that will be informative and help to better elaborate disease processes.

We are strategic about what we test because we can’t afford to do everything at once. But imagine what we could learn from 50,000 people if we perform, for example, methylome testing to estimate their biological clocks to examine age acceleration, and then correlate those findings with other omics information and robust phenotypic data. That’s the kind of paradigm we want to advance.

1 Like

In the end, however, the acidity of fasting serum may be a better measure than most of the methylation clocks.

2 Likes

Just came across the acidity issue in researching lactate monitoring as a measure of mitochondrial health. Do you do any lactate monitoring for this purpose?
Important for cancer cells.
I’m surprised there isn’t more discussion of measures of mitochondrial health to determine biological age.

I don’t monitor lactate, but that does not mean it is a bad idea.

1 Like

L-Lactate Influences Brain Energy Metabolism

Mitochondria are best known for their role in the generation of ATP that supplies eukaryotes with energy to serve their cellular needs (104). Recent studies report that L-lactate can also mediate various mitochondria-related genes. A novel discovery is first reported by Brooks’s team in L6 cells (105). They find that 20 mM L-lactate can upregulate 79 genes involved in mitochondrial metabolism (MFN1, MFN2, PGC-1α, NRF2, LDHb, ATP5g1, NADH-dh, SDH, and TIM) and oxidative stress (GPX1, Glrx2, Glrx5, Prdx2, and Txndc12) (105). The evidence is also verified in the brain. For example, intraperitoneal injection of 18 mM L-lactate for 14 consecutive days will promote the PRC mRNA expression and the mtDNA levels (8). 20 mM L-lactate pretreats SY5Y cells can reverse high-concentration hydrogen peroxide (H2O2)-induced oxidative stress injury, including NRF2 expression improvement and mitochondrial membrane potential potentiation (106). The biological effect of L-lactate mediating mitochondrial metabolism and function is also in the primary mouse neurons. A total of 15–20 mM L-lactate can improve mitochondrial fusion (OPA1, MFN1, and MFN2), inhibit mitochondrial fission (DRP1 and FIS1), and promote biogenesis (PGC-1α, NRF2, TFAM, and mtDNA) (3, 107) (Figure 2). Besides, “cytosol-mitochondria lactate shuttle” also elaborates the role of L-lactate as the substrate source of mitochondrial ATP production (53, 56–58). Thus, L-lactate ought to have a close relationship with mitochondria in the brain. Considering the fact that multiple brain diseases in a large part are also associated with the energy crisis, the application of L-lactate in an animal-related experiment to shed light on the effect and mitochondria mechanism on brain energy metabolism as early as possible should have a great significance of the novel treatment in clinic brain diseases.

https://pmc.ncbi.nlm.nih.gov/articles/PMC9099001/#abstract1

1 Like

More on the pro and con of lactate for mitochondria.

For many years, the fact that lactate is a major regulator
of intermediary metabolism was not appreciated. Far from
being a ‘dead end’ metabolite produced as the result of
oxygen insufficiency, we now know that lactate is a major
energy source, the major gluconeogenic pre-
cursor, and a signaling molecule, a ‘lactormone’
responsible for diverse actions such as gene expression
and control of lactate-responsive genes such as GPR81 and
TREK1 (vide infra). In the process of shuttling
between sites of production and removal, lactate exerts
profound effects on fat and carbohydrate metabolism. Because
lactate is a preferred fuel over glucose in the heart [69],
working muscle and brain, hyperlactatemia
affects glucose uptake and oxidation by substituting for
pyruvate and lactate produced from glycolysis in widely
dispersed tissues.

On a population-wide basis it could be very helpful to
diagnose defects in mitochondrial function years ahead of
the development of chronic, mitochondrial-derived meta-
bolic diseases. However, to our knowledge, there are no
current tests to measure mitochondrial function in a mini-
mally invasive, cost-effective, ambulatory manner. More-
over, in the same manner that cardiology exercise stress
tests are useful to study cardiac electrophysiology to
diagnose cardiomyopathies, graded exercise tests as used
here could be a surrogate method to stress and assess
mitochondrial function and effects on metabolic flexibility
in vivo.

Increased muscle mitochondrial mass is
characteristic of elite professional endurance athletes
(PAs), whereas increased blood lactate levels (lactatemia)
at the same absolute submaximal exercise intensities and
decreased mitochondrial oxidative capacity are character-
istics of individuals with low aerobic power. In contrast to
PAs, patients with metabolic syndrome are charac-
terized by a decreased capacity to oxidize lipids and by
early transition from fat to carbohydrate oxidation, as well as elevated blood lactate concentration
as exercise power output increases, a condition
termed ‘metabolic inflexibility’.

Blood lactate accumulation is negatively
correlated with fat oxidation and positively correlated with
carbohydrate oxidation during exercise across populations with widely
ranging metabolic capabilities. Because both lactate and
fatty acids are mitochondrial substrates, we believe that
measurements of blood lactate concentration and fat oxidation rate during exercise
provide an indirect method to assess metabolic flexibility
and oxidative capacity across individuals of widely dif-
ferent metabolic capabilities.

Conclusions
Our data show consistent and strong inverse correlations
between blood lactate and fat oxidation, as well as between
fat oxidation and carbohydrate oxidation, in all three groups studied. Because
both fat and lactate oxidation occur in skeletal muscle
mitochondria, we advocate for our method as plausible for
indirectly measuring mitochondrial function and metabolic
flexibility in different populations. Furthermore, as the
inverse correlations between blood lactate and fat oxidation are
robust, we also show that assessing blood lactate alone is
an effective way to indirectly assess mitochondrial function
and metabolic flexibility during exercise in different types
of populations with completely different metabolic
responses to exercise. Finally, because lactate exerts pro-
found effects on fat and carbohydrate metabolism, a poor lactate
clearance capacity due to mitochondrial
lactate oxidation complex limita-
tions greatly affect fat oxidation and carbohydrate oxidation, which could result
in metabolic dysregulation, and which, in turn, may give
rise to IR, T2DM, and possibly other chronic diseases,
including cardiometabolic diseases.

Assessment of Metabolic Flexibility by Means of Measuring Blood
Lactate, Fat, and Carbohydrate Oxidation Responses to Exercise
in Professional Endurance Athletes and Less-Fit Individuals

https://www.researchgate.net/publication/317660005_Assessment_of_Metabolic_Flexibility_by_Means_of_Measuring_Blood_Lactate_Fat_and_Carbohydrate_Oxidation_Responses_to_Exercise_in_Professional_Endurance_Athletes_and_Less-Fit_Individuals

1 Like